California's jobs gap
by CalWatchdog Staff | January 10, 2010 3:52 pm

Jan. 11, 2010
By JOHN SEILER California continues to stagger under unemployment levels higher than the national average. The latest figures, released on Dec. 18, 2009, show that the state suffered 12.3 percent unemployment compared to the national average of 10 percent. Call it a “Jobs Gap” of 2.3 percentage points for November. (For all of 2009, January through November, the average Jobs Gap is 2.4 percentage points.)
Is there a connection between California’s tax-heavy and regulation-heavy government and state unemployment?
A good way to begin looking at this Jobs Gap is to compare California’s burden of government with that of other states to see how it affects unemployment.

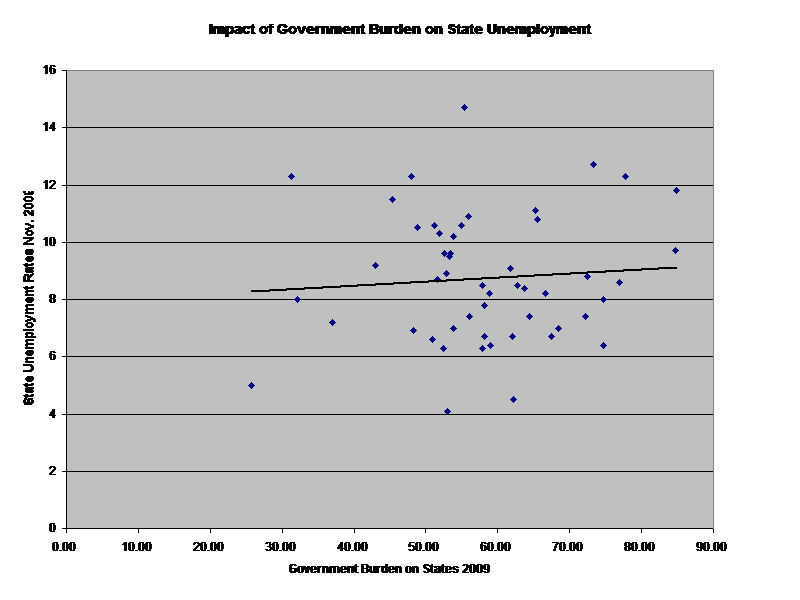
The graph above plots two sets of data. The Y axis, on the left, shows the unemployment rate for each state for November 2009.
The X axis, on the bottom, shows the burden of government, based on the “Small Business Survival Index 2009: Ranking the Policy Environment for Entrepreneurship Across the Nation[1]” (.pdf), released on Dec. 1, 2009. (Summary here[2].)
The Index has been produced annually since 1994 by the Small Business & Entrepreneurship Council[3]. The Index covers 36 government-related costs to business, including taxes, various regulatory costs, government spending, property rights, health care and energy costs. On the Index, California ranks 49th worst of the 50 states. The Index’s average is 58.11. California’s Index score is 77.75. (On the chart, it’s the third plot point from the right.)
Only New Jersey is worse, at 84.73. (The District of Columbia, though not a state, is yet worse, at 84.80.)
The Trend Line clearly shows that, the higher the burden of government, the higher the unemployment. The connection is not exact, but nevertheless clear.
As one would expect in a country as large and diverse as America, the results vary widely. Michigan has a middling government burden of 55.38 on the SBEC Index. Yet its unemployment is the highest in the nation, at 14.7 percent, well above the trend line, due to its mostly bankrupt auto industry. Vermont, with a relatively high government burden of 74.72 on the SBEC Index, scores well under the trend line with unemployment of just 6.4 percent.
Despite such outliers, the trend line shows that more state government means more unemployment.
“It shouldn’t be surprising that states ranking poorly on our Index are having a tough time,” Raymond Keating, chief economist at the SBEC, told me. “When you look at where California ranks, and all the hurdles elected officials have set up for entrepreneurs over the years, it makes it extremely difficult to start and keep a business.”
He pointed out that California imposes capital gains taxes, alternative minimum taxes and other taxes other states don’t even have. “It’s not surprising that California has economic and fiscal problems – they go together.”
California’s historical unemployment trends
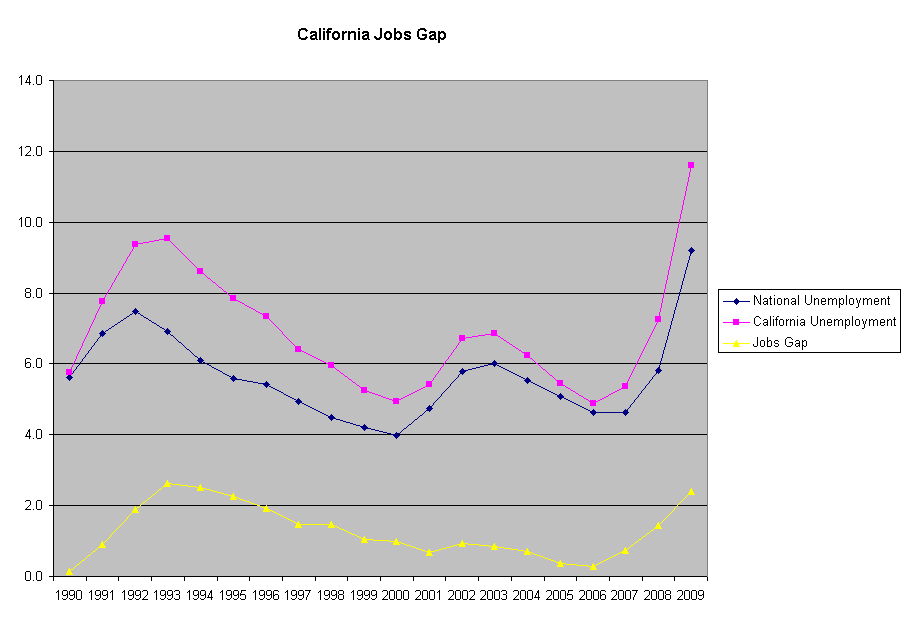
The second way to look at California unemployment is historical. The following graph shows California unemployment rate over the past 20 years. The graph uses yearly averages, not the monthly ones mentioned in at the start of this study. So for 2009 the average is for January to November.

The key is the yellow line at the bottom. It shows the difference between California and national unemployment for each year – the Jobs Gap. Using this filters out most national factors, such as national tax rates and regulations that affect everyone in every state. The analysis isn’t perfect, because some national policies affect some states more than others. But it does show us a window into what has been happening.
At the beginning, in 1990, there basically is no Jobs Gap. But two things happened that year. In June, voters passed Proposition 111[4] by a slim 52 percent to 48 percent margin. Entitled the “Traffic Congestion Relief And Spending Limitation Act Of 1990,” and advertised as a measure to bring relief to California’s perennially clogged roads while limiting overall spending, its real intention was to gut the Gann Limit.
Passed by voters in 1979 as Proposition 4, the Gann Limit[5] prohibited state spending beyond increases in population plus inflation. For a decade, it held California spending in check, producing balanced budgets. In 1987, the limit even mandated a tax refund of $1.1 billion. After Prop. 111 in 1990, the Gann Limit was basically gone. There was no limit on spending.
The second event of 1990 was the election of Republican Pete Wilson as governor. In 1991, he met a $14 billion budget deficit with spending cuts and a record $7.3 billion tax increase. Ironically, instead of increasing revenues, revenues dropped from $42 billion in fiscal year 1991-92 to $40 billion in 1993-94. (See Schedule 6 on Page Appendix 13 of this .pdf[6].)
And as the chart shows, the Jobs Gap shot up, to 2.6 percentage points in 1993. When even a Republican governor increased taxes, many businesses decided the time was not right to create jobs.
Most of Wilson’s tax increases ended in 1995. As then-Senate Republican Leader Rob Hurtt of Garden Grove pointed out at the time, the end of the increases would mean the beginning of job growth. He was right. The Jobs Gap shrank throughout the late 1990s, as taxes dropped; and as Wilson used large budget surpluses to enact a few new tax cuts. By 1999, the year new Democratic Gov. Gray Davis took power, the Jobs Gap was down to 1 percentage point.
During Davis’ years in office, the Jobs Gap remained at just under 1 percentage point. Although unemployment rose because of the dot-com bust of the early 2000s, to 6.8 percent in 2003 (the year Davis was recalled), that was only 0.8 percentage points above the national rate of 6 percent.
After the Davis recall and the election of Gov. Arnold Schwarzenegger in 2003, the Jobs Gap dropped further, to just 0.3 percent in 2006. Effectively, the Jobs Gap was gone. Schwarzenegger, although not perfect in fiscal and regulatory matters, generally took a pro-business attitude in his first two years in office.
After taking office in November 2003, he quickly canceled an illegal car tax Davis had imposed months earlier. In 2004 Schwarzenegger worked with the Democratic Legislature to enact landmark workers’ compensation reform[7] that cut costs for business. He routinely vetoed anti-business laws passed by the Legislature. He insisted on no tax increases. He started work on “blowing up the boxes” of the state’s expensive and inefficient government bureaucracy.
It didn’t last. In November 2005, Schwarzenegger backed a slate of reform proposals that would have curbed union power, limited spending and ended gerrymandering of congressional and state legislative districts. Voters rejected every reform.[8]
After the wipeout, Schwarzenegger did an about-face and began backing more spending and regulations. The worst of these regulations was Assembly Bill 32, which mandated reducing greenhouse gas emissions by 25 percent by 2020. I wrote about this in a previous Calwatchdog article[9].
Soon, as the national recession washed over the state, the budget went wildly out of balance. In February 2009 the governor worked with the Legislature to increase taxes by $13 billion[10]. His press release’s headline promised it would “Solve $24 Billion Deficit[11].” But in November 2009, a deficit of $21 billion was still projected[12].
Meanwhile, the Jobs Gap had been rising, to 1.4 percentage points in 2008 and to 2.4 percentage points in 2009 (yearly average through November).
State government policies aren’t the whole story, but a major factor in it. California has been hit hard also by two other factors that don’t directly involve the state government, Esmail Adibi told me; he’s director of the A. Gary Anderson Center for Economic Research[13] and Anderson Chair of Economic Analysis at Chapman University in Orange.
“We had a higher exposure to the mortgage, housing and construction industries,” he said. So when they were hit hard by the housing bust, the “trickle down” effect hurt other industries. “It spilled first into retail, then wholesale, then transportation.”
During the boom times early in the decade, California enjoyed the “wealth effect,” in which zooming housing prices led people to spend some of their new-gained wealth to buy other things, such as house renovations and large flat-screen TVs. Now we’re suffering “a reverse wealth effect,” he said, with people sharply cutting back spending.
The second factor hitting California extra hard is that “the nature of our economy includes lots of self-employment,” Adibi said. “A lot of people active in these sectors – such as Realtors and landscapers – became unemployed.”
According to Adibi, California’s higher taxes and regulations relative to other states do not necessarily kill jobs, but more directly affect job creation. “Once unemployment increases, you have to create jobs,” he said. “But job creation will not be as strong as other areas of the country,” as companies shy away from California’s harsh tax and regulatory climate.”
John Seiler, an editorial writer for 19 years at The Orange County Register, currently is a freelancer who writes for Calwatchdog. His email: [email protected].
Appendix I: How high is unemployment?
The unemployment data[14] used here come from the Dec. 18, 2009 release from the Bureau of Labor Statistics of the U.S. Labor Department. However, it’s worth noting that the Clinton administration changed the calculations to exclude those underemployed – those who are not working as much as they would like, or who have stopped looking for work.
A useful Web site, ShadowStats.com[15], provides the data using the old formulas. It calculates that the U.S. unemployment is not 10 percent, as the BLS says, but double that.
These alternate data do not affect my conclusions, as I am comparing trends and the differences among states. But it’s worth keeping in mind that unemployment actually is worse than the official numbers say.
Appendix II: Data
Table I: SBEC Index and Unemployment.
| SBEC Index | Unemployment Nov. 2009 | |
| Alabama |
48.82 |
10.5 |
| Alaska |
51.55 |
8.7 |
| Arizona |
52.80 |
8.9 |
| Arkansas |
56.01 |
7.4 |
| California |
77.75 |
12.3 |
| Colorado |
48.25 |
6.9 |
| Connecticut |
66.63 |
8.2 |
| Delaware |
62.78 |
8.5 |
| Florida |
45.28 |
11.5 |
| Georgia |
53.78 |
10.2 |
| Hawaii |
68.45 |
7 |
| Idaho |
61.71 |
9.1 |
| Illinois |
55.98 |
10.9 |
| Indiana |
52.60 |
9.6 |
| Iowa |
67.49 |
6.7 |
| Kansas |
57.81 |
6.3 |
| Kentucky |
54.88 |
10.6 |
| Louisiana |
58.11 |
6.7 |
| Maine |
74.70 |
8 |
| Maryland |
64.34 |
7.4 |
| Massachusetts |
72.52 |
8.8 |
| Michigan |
55.38 |
14.7 |
| Minnesota |
72.15 |
7.4 |
| Mississippi |
53.44 |
9.6 |
| Missouri |
53.28 |
9.5 |
| Montana |
59.04 |
6.4 |
| Nebraska |
62.14 |
4.5 |
| Nevada |
31.35 |
12.3 |
| New Hampshire |
62.00 |
6.7 |
| New Jersey |
84.73 |
9.7 |
| New Mexico |
58.10 |
7.8 |
| New York |
76.94 |
8.6 |
| North Carolina |
65.50 |
10.8 |
| North Dakota |
53.04 |
4.1 |
| Ohio |
51.25 |
10.6 |
| Oklahoma |
53.87 |
7 |
| Oregon |
65.18 |
11.1 |
| Pennsylvania |
57.85 |
8.5 |
| Rhode Island |
73.34 |
12.7 |
| South Carolina |
48.00 |
12.3 |
| South Dakota |
25.69 |
5 |
| Tennessee |
51.86 |
10.3 |
| Texas |
32.08 |
8 |
| Utah |
52.40 |
6.3 |
| Vermont |
74.72 |
6.4 |
| Virginia |
50.84 |
6.6 |
| Washington |
42.96 |
9.2 |
| West Virginia |
63.69 |
8.4 |
| Wisconsin |
58.80 |
8.2 |
| Wyoming |
37.07 |
7.2 |
| District of Columbia |
84.80 |
11.8 |
| Average |
58.11 |
Table 2: Jobs Gap By Year, 1990-2009. (Note: 2009 is the average of Jan. – Nov.)
| National | California | Jobs Gap | ||
|
1990 |
5.6 |
5.8 |
0.1 |
|
|
1991 |
6.9 |
7.8 |
0.9 |
|
|
1992 |
7.5 |
9.4 |
1.9 |
|
|
1993 |
6.9 |
9.5 |
2.6 |
|
|
1994 |
6.1 |
8.6 |
2.5 |
|
|
1995 |
5.6 |
7.9 |
2.3 |
|
|
1996 |
5.4 |
7.3 |
1.9 |
|
|
1997 |
4.9 |
6.4 |
1.5 |
|
|
1998 |
4.5 |
6.0 |
1.5 |
|
|
1999 |
4.2 |
5.3 |
1.0 |
|
|
2000 |
4.0 |
4.9 |
1.0 |
|
|
2001 |
4.7 |
5.4 |
0.7 |
|
|
2002 |
5.8 |
6.7 |
0.9 |
|
|
2003 |
6.0 |
6.8 |
0.8 |
|
|
2004 |
5.5 |
6.3 |
0.7 |
|
|
2005 |
5.1 |
5.4 |
0.4 |
|
|
2006 |
4.6 |
4.9 |
0.3 |
|
|
2007 |
4.6 |
5.4 |
0.7 |
|
|
2008 |
5.8 |
7.2 |
1.4 |
|
|
2009 |
9.2 |
11.6 |
2.4 |
|
- Small Business Survival Index 2009: Ranking the Policy Environment for Entrepreneurship Across the Nation: http://www.sbecouncil.org/uploads/SBSI2009.pdf
- here: http://www.sbecouncil.org/uploads/SBSI2009%20Release%20US%5B1%5Dpdf%20version.pdf
- Small Business & Entrepreneurship Council: http://www.sbecouncil.org/home/
- Proposition 111: http://www.ballotpedia.org/wiki/index.php/California_Proposition_111_%281990%29
- Gann Limit: http://www.caltax.org/member/digest/July2000/jul00-9.htm
- this .pdf: http://www.ebudget.ca.gov/pdf/BudgetSummary/FullBudgetSummary.pdf
- workers’ compensation reform: http://www.californiaspaceauthority.org/html/government_pages/workerscomp.html
- Voters rejected every reform.: http://en.wikipedia.org/wiki/California_special_election,_2005
- previous Calwatchdog article: http://www.calwatchdog.com/2010/01/08/new-gut-ab32-to-save-jobs/
- increase taxes by $13 billion: http://online.wsj.com/article/SB123503429614220905.html
- Solve $24 Billion Deficit: http://gov.ca.gov/press-release/12903/
- still projected: http://www.latimes.com/news/local/la-me-budget-deficit18-2009nov18,0,7647152.story
- A. Gary Anderson Center for Economic Research: http://www.chapman.edu/argyros/asbecenters/acer/default.asp
- unemployment data: http://www.bls.gov/news.release/laus.nr0.htm
- ShadowStats.com: http://www.shadowstats.com/
Source URL: https://calwatchdog.com/2010/01/10/new-californias-growing-jobs-gap/