Chart shows govt. shutdown HELPS markets
by John Seiler | October 5, 2013 1:39 am
Government officials are warning that, if the shutdown continues, the economy will be harmed. President Obama said Thursday[1]:
academic assignment[2]
“It is important for [Wall Street] to recognize that this is going to have a profound impact on our economy and their bottom lines, their employees and their shareholders.”
A Treasury Department report warned:
“A default would be unprecedented and has the potential to be catastrophic: credit markets could freeze, the value of the dollar could plummet, U.S. interest rates could skyrocket, the negative spillovers could reverberate around the world, and there might be a financial crisis and recession that could echo the events of 2008 or worse.”
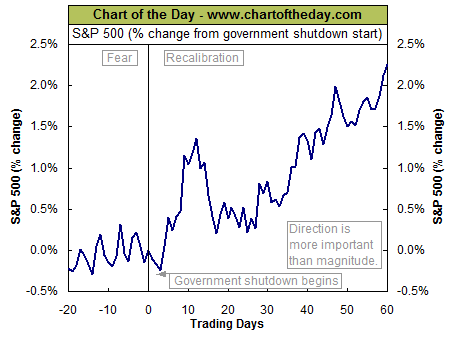
But the folks at Chart of the Day[3] produced a graphic showing something else[4]:
 [5]
[5]
Here's Chart of the Day's explanation:
“Monday marked the beginning of the 18th government shutdown in US history. For some perspective, today's chart plots the average S&P 500 performance for the 20 trading days (approximately one calendar month) before and 60 trading days (approximately 3 calendar months) after a government shutdown began. As today's chart illustrates, the stock market has tended to struggle prior to and during the initial three days following a government shutdown. Following this, the stock market has (on average) trended higher over the ensuing three months. One explanation for this particular average pattern is that the market abhors uncertainty. So as the shutdown approaches, investors fear for the worst. However, after the shutdown begins and investors notice that the economy continues to function coupled with the fact that the shutdown may be short-lived ultimately encourages a stock market rally as investors worst fears are not realized. It should be noted that today's chart is an average performance chart and that following the last 17 shutdowns, the stock market traded up 60 trading days after a shutdown on 10 out of 17 occasions (i.e. 58.8%) with the average shutdown lasting 6.4 calendar days.”
- said Thursday: http://www.cnbc.com/id/101081257
- academic assignment: http://domyassignmentonline.com/assignment-writing-anf-editing-phd-experts-are-here-to-help-you/
- Chart of the Day: http://www.chartoftheday.com/20131002.htm?H
- showing something else: http://www.latimes.com/business/money/la-fi-mo-debt-limit-shutdown-treasury-economy-20131003,0,1595686.story
- [Image]: http://calwatchdog.com/wp-content/uploads/2013/10/Chart-shutdowns-chart-of-the-day-Oct.-4-2013.gif
Source URL: https://calwatchdog.com/2013/10/05/chart-shows-govt-shutdown-helps-markets/