Chart shows warning on economy, CA budget
by John Seiler | August 21, 2014 1:50 pm
Since the 9/11 attack almost 13 years ago, the Federal Reserve Board has been inflating the dollar. Everybody has noticed the increases in food, gas and other prices. That’s why the supposed “records” set by the stock market are suspect.
Instead, look at this chart of the DJIA pegged against gold.
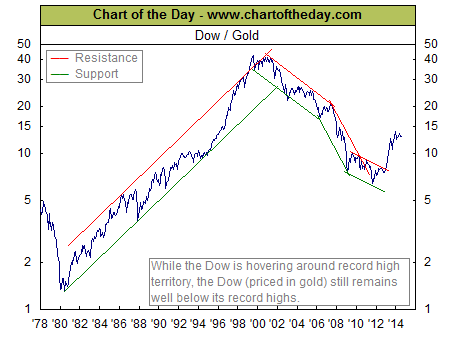
It shows that the DJIA still has not recovered where it was before 9/11, although it has done better recently. That means the national and California economic recoveries are hollow. They’re built on inflation.
Yet Gov. Jerry Brown and the Legislature have built their budgets on the assumption that the economy is in recovery, and will continue recovering. As Brown keeps insisting, “California is back.”
But if they’re wrong, when the next recession hits, we could again have deficits in the $20 billion to $40 billion range.
Friends of mine in the real estate industry tell me that the whole thing is softening now; that the recent gains in prices are over. Something similar happened in 2006 before the big real estate crash, followed by the national economic crash.
I’m not making any predictions. I’m only warning that it makes sense to be prepared. And California is not prepared.
Proposition 2[1], the Rainy Day Budget Fund Stabilization Act, is on the November ballot. But it hasn’t been passed yet. And it only would establish a modest fund.
- Proposition 2: http://ballotpedia.org/California_Proposition_2,_Rainy_Day_Budget_Stabilization_Fund_Act_(2014)
Source URL: https://calwatchdog.com/2014/08/21/chart-shows-warning-on-economy-ca-budget/