Solar crash ramped up CA natural gas power
by Wayne Lusvardi | November 12, 2014 2:03 pm
 Yesterday a problem struck California’s electricity system that wasn’t supposed to happen until at least 2015.
Freak low-lying clouds at about 3 p.m. cut temperatures to only 68 degrees in Los Angeles and 64 in San Francisco[1], about 6 degrees below normal, increasing demand for electricity to heat homes and businesses — even as the clouds cut the solar-powered production of electricity.
Guess what kept the lights and heat on. Long-demonized fossil fuels, which don’t peter out when the sunshine dims.
Bloomberg reported[2]:
“Output from solar plants totaled 2,813 megawatts in the hour ended at 1 p.m. local time, 21 percent lower than the day-ahead forecast for the hour, according to the California Independent System Operator Inc.’s website. Demand has been higher than the grid manager projected during the work day.
“Spot prices at Northern California’s NP15 hub jumped $13.99, or 64 percent, to $35.86 a megawatt-hour in the hour ended at 1 p.m. from the same time yesterday, grid data compiled by Bloomberg show. Prices at Southern California’s SP15 hub increased $13.11, or 62 percent, to $34.37.”
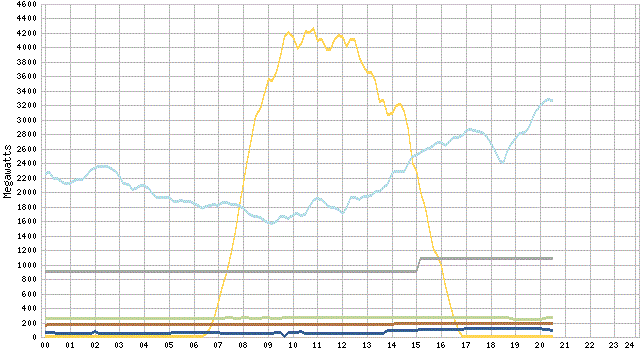
Normally this time of year, solar power doesn’t slacken until dusk at about 5 p.m. That’s also when businesses start shutting down, so a shift can be made from solar to other types of electricity generation. The following chart shows what happened yesterday with solar power:
Solar power generated per hour in megawatts – Nov. 11, 2014
(California Independent System Operator)
| Time | 7am | 8am | 9am | 10am | 11am | 12am | 1pm | 2pm | 3pm | 4pm | 5pm | 6pm |
| Mega-watts | 200 | 2000 | 3400 | 4000 | 4000 | 4000 | 3600 | 3200 | 2200 | 1000 | 0 | 0 |
Solar power generated around 4,000 megawatts at peak hours of the day. Total solar power generated for Nov. 11 was 27,600 megawatt-hours. And that was about 4.9 percent out of about 576,000 total megawatt hours for all power for the whole day (see footnote 1 below).
In other words, solar power is only reducing fossil fuel emissions for less than 5 percent of the electricity demand each day at a cost of over 60 percent higher than natural gas prices for 12 to 25 percent of the hours each day.
Here’s a chart of all renewable use on Nov. 11. Note that solar power is in yellow, and wind power in light blue.
‘Duck chart’ problem
Solar power industry advocates are quick to advertise[3] that solar power is becoming cheaper than gas in California. What they omit is that this is only for a small portion of the day. And the erratic solar use causes natural-gas power prices to rise during the sunset hours each day, what is called the “duck chart” problem because it looks like a duck.
The “duck chart” problem is when — even on normal days — the new green power grid ramps up enough conventional power each day between two events: 1) when solar power is sunsetting (going dark); and 2) when the mostly nighttime wind power isn’t spinning enough yet to take over.
The problem is seen in the following chart, where the lines like a duck with a tail, protruding belly and beak. The “neck” area is sunset every day when conventional energy “ramps up” to replace solar power.
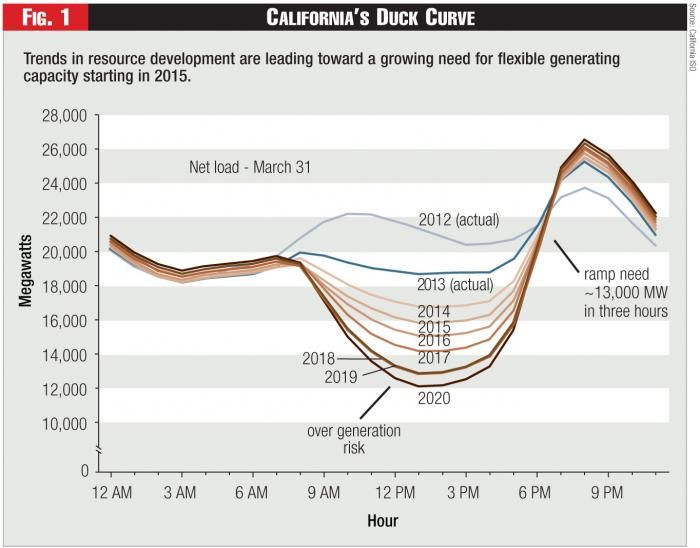
As shown on the chart, this ramping problem becomes more pronounced from about 4:15 pm to 6:15 pm each day. The “duck chart” shows there is a demand in California to ramp up 13,500 megawatts of conventional power in a narrow two-hour window of time at sunset each day to replace solar power going offline.That would be enough power for about 6.75 million homes per hour.
This “duck chart” problem was supposed to wait until 2015 or later to quack. But yesterday California got a foretaste of what’s going to happen.
State launching costly solar power battery storage
To solve the problem that struck yesterday, Assembly Bill 2514[4], passed in 2013, mandated that regulated electric utilities must procure 1,320 megawatts of very expensive solar-battery storage. By contrast, natural gas is cheaply stored in huge underground wells and can be released instantly to meet emergency demands.
The U.S. Energy Information Agency reported that, as of Oct. 31, the Western United States had about 498 billion cubic feet of “working gas” in underground storage[5].
The Southern California Gas Company[6] has four underground natural-gas storage facilities located at Aliso Canyon, Honor Rancho, Goleta and Playa Del Rey. The total capacity is 136 billion cubic feet of gas.
Storage protects against gas-supply imbalances, curtailments and arbitrage (i.e., price flipping). In other words, underground natural gas storage already serves as a “battery.”
A Sandia National Laboratories study[7] in 2011 conducted for the U.S. Department of Energy reported the costs for energy storage ranged from a low of $5 per kilowatt hour to a high of $10,000 per kilowatt hour. (A kilowatt hour is enough electricity to power your home for one hour.)
By comparison, the average price of residential electricity in Los Angeles was a fraction of that, at 21.6 cents per kilowatt-hour[8] in Sept. 2014.
California’s Renewable Energy Mandate[9] of 33 percent green power by 2020 is costing more than expected. To solve this problem, California is setting up an “Energy Imbalancing Market”[10] to buy cheaper imported hydropower from Warren Buffett to meet its demands during the sunset hours each day.
In 2012, California’s Little Hoover Commission[11] asked Gov. Jerry Brown to report what the transition to renewable energy is going to cost. Brown failed to respond. So the Commission sent a letter[12] to Brown in October 2014 again requesting he report the impact of renewable energy on electricity rates.
Meanwhile, California is being bailed out of its quiet, daily energy crises by cheap natural gas from hydraulic fracturing or fracking, which some counties want to ban[13].
Footnote 1: The Cal-ISO[14] forecasted approximate average demand for Nov. 12 was 24,000 megawatts per hour. 24,000 megawatts x 24 hours = 576,000 megawatt hours. 27,600 of 576,000 megwatts is 4.9 percent.
- 68 degrees in Los Angeles and 64 in San Francisco: http://www.bloomberg.com/news/2014-11-11/california-spot-power-climbs-as-solar-output-dips.html
- reported: http://www.bloomberg.com/news/2014-11-11/california-spot-power-climbs-as-solar-output-dips.html
- advertise: http://www.renewableenergyworld.com/rea/news/article/2011/02/solar-pv-becoming-cheaper-than-gas-in-california
- Assembly Bill 2514: http://www.leginfo.ca.gov/pub/09-10/bill/asm/ab_2501-2550/ab_2514_bill_20100929_chaptered.pdf
- 498 billion cubic feet of “working gas” in underground storage: http://ir.eia.gov/ngs/ngs.html
- Southern California Gas Company: http://www.socalgas.com/for-your-business/ceh.shtml
- A Sandia National Laboratories study: http://prod.sandia.gov/techlib/access-control.cgi/2011/112730.pdf
- 21.6 cents per kilowatt-hour: http://www.bls.gov/ro9/cpilosa_energy.htm
- Renewable Energy Mandate: http://articles.latimes.com/2011/apr/13/local/la-me-renewable-energy-20110413
- “Energy Imbalancing Market”: http://calwatchdog.com/2013/11/11/will-warren-buffetts-hydro-prevent-ca-electricity-crisis-part-2/
- Little Hoover Commission: http://calwatchdog.com/2014/11/06/little-hoover-questions-green-energy-costs/
- letter: http://www.lhc.ca.gov/studies/223/Report223.pdf
- ban: http://blogs.kqed.org/science/2014/11/05/new-california-county-fracking-bans-likely-to-face-challenges/
- Cal-ISO: http://www.caiso.com/Pages/TodaysOutlook.aspx
Source URL: https://calwatchdog.com/2014/11/12/solar-crash-ramped-up-ca-natural-gas-power/