
Chart shows how weak recovery is
The DOW stock index supposedly shows we’re enjoying a strong recovery. It recently set records, although it’s off a bit today.
Not really. Thanks to Chart of the Day, here’s the history of the DOW adjusted for inflation:
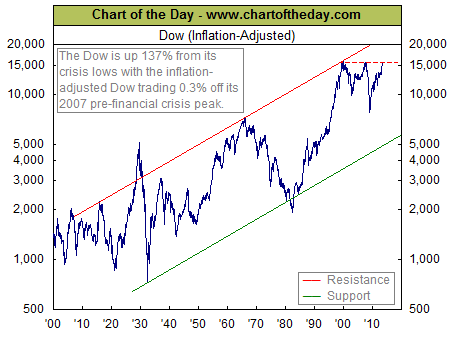
Notice a couple of things:
* The incredible 1929 stock crash is evident.
* There was a weak recovery in the mid-1930s during the New Deal, sort of like today under the Obama Deal.
* Strong, lasting recovery didn’t begin until 1946, just after World War II. As economists Vedder and Gallaway explain, President Truman wanted to keep most of the New Deal measures and wartime controls. But Congress bucked him, cut the controls and also cut taxes, sparking the boom that lasted until the late 1960s.
* In the late 1960s, the massive expense of LBJ’s Great Society and Vietnam War began buckling the economy; he imposed a 10 percent surtax in 1968.
* In 1971, with his “Nixon Shock,” President Nixon jolted the economy with wage and price controls, tax increases, tariffs and going off the gold standard. That artificially boosted the economy past his 1972 re-election. Then the bottom fell out of the economy. We suffered “stagflation” (stagnation + inflation) and the “malaise economy.” The stock market kept declining.
* In 1983, President Reagan’s tax increases finally kicked in with full force, beginning nearly a 20-year run of prosperity, with only one minor recession. He also cut regulations. Budgets were not cut enough, hence the deficits of those days. And a quasi-gold standard was restored by Fed Chairman Paul Volcker, with gold pegged at about $350 an ounce, stabilizing prices and quieting inflation.
* Bill Clinton’s second term included tax cuts that canceled the tax increases of his first term; welfare reform; and the first budgets in three decades.
* The dot-com bust of 1999-2000 was a minor problem.
* In 2001, terrorists flew planes into the World Trade Center and the Pentagon. President Bush and Fed Chairman Alan Greenspan panicked. Bush went on a wild spending binge, reversing the Clinton spending restraint and bringing back the mega-deficits. Not just defense was increased; two-thirds of new spending was domestic. His tax cuts were defective because they had an expiration date. Greenspan inflated the currency, with gold rising sharply above the $350 average of the previous 20 years. And Greenspan kept interest rates artificially low, blowing up the housing bubble of the mid-decade.
* In 2007-08, the economy collapsed, which is shown in the cart.
* From 2008 to now, supposedly the policies of Fed Chairman Bernanke and President Obama have “saved” us. But as the chart shows, the DOW, adjusted for inflation, only is back to where it was 15 years ago. American now is suffering a second “lost decade.” Even the Fed today reported, according to AP, “that the U.S. economy is growing only modestly, a downgrade from its June assessment. The Fed expects growth will pick up in the second half of the year, but the more cautious message may be a signal that it’s not ready to slow its bond purchases soon.”
I short, it’s cuts in taxes and regulations, plus stable money, that produce growth; and increases in taxes and regulations, plus unstable money, that impose stagnation or recession.
Related Articles

"$800K Man" a government hero
John Seiler: We all need heroes. People we can look up to as examples and for inspiration. Government workers now

Brown’s CalSTRS fix hammers districts, protects teachers
Contrary to the impression given by some of the current coverage of Sacramento’s attempts to shore up the California State

CA “community solar” fight looms on subsidy issue
Hawaii’s boom in residential solar power is inspiring advocates of the alternative energy resource to push hard in states across
