
Chart shows Brown budget follows Gann Limit
 Gov. Jerry Brown and Democratic legislators are congratulating themselves on passing a budget by the June 15 deadline and keeping a lid on spending. They insist they’re avoiding the excess spending that got the state into trouble when past recessions hit in 1990, 2000 and 2007, producing massive deficits that were dealt with, in each case, by large budget cuts and tax increases.
The following chart shows they actually are being fairly prudent. The key is the Gann Limit initiative, which voters passed as Proposition 4 in 1979 with 74 percent of the vote. It was backed by Brown. It imposed a limit on general-fund increases in spending of population increase plus inflation.
The idea was that the people of California can only bear so high a level of taxing and spending. And that the amount they bear can only increase when population and inflation go up. The idea really is obvious. For example, a 10-year-old child can only lift so much weight. But when he grows older, he can lift more — but not until then.
The Gann Limit prevented excess spending throughout the 1980s, and even a tax refund in 1987.
Unfortunately, in 1990 voters passed Proposition 111. Advertised as a measure to reduce traffic congestion, it effectively gutted the Gann Limit. Doing so restored the yo-yo budgeting that has seen spending swell during good times, then collapse during bad times.
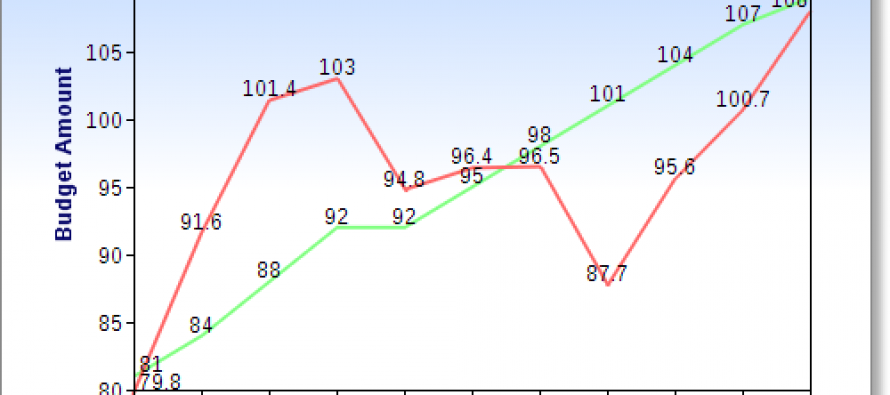
The following graph shows two things for the past decade, all numbers for the general fund:
- In red, actual spending.
- In green, spending if the Gann Limit had been in effect.
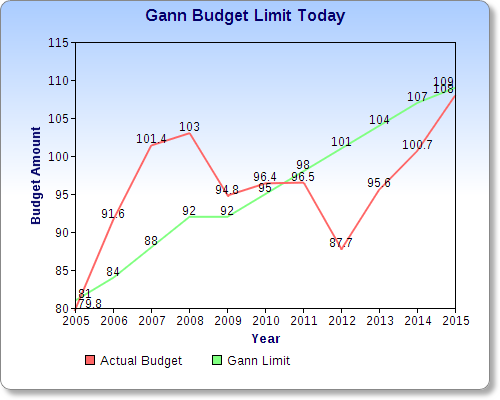
As you can see, if the Gann Limit had been in effect, the spending limit for fiscal 2014-15 (just “15” on the chart) would be about $109 billion. Close enough for government work to the actual amount of $108 billion.
Schwarzenegger splurge
Notice a couple of other things. The red line (actual spending) soared way above the green line (Gann Limit speding) from 2005 through 2008. Those were the years when Gov. Arnold Schwarzenegger and the Democratic Legislature went on a wild spending splurge during the phony real-estate boom that collapsed in 2008-09. Ironically, Arnold won election in 2003 on a pledge to end the “crazy deficit spending” of recalled Gov. Gray Davis.
Breaking his no-new-taxes pledge, Arnold’s record $13 billion tax increase in 2009 then slowed the state economy more than the rest of the country, hampering revenue collections because bankrupt businesses and citizens don’t pay taxes. The red line (actual spending) then dropped way below the green line (Gann Limit spending) until the new fiscal year of 2014-15, which begins on July 1.
Finally, notice how the green line (Gann Limit spending) rises gradually every year, as you would expect because it tracks inflation plus population growth. This shows that, if the state just maintains an adequate rainy-day fund to take care of budget deficits in recessionary years, it could avoid the downward budget crashes during recessions.
And if it doesn’t splurge — that is, spend above the green line — during prosperous years, it can avoid the excessive spending that painfully has to be cut during recessions.
Republicans are complaining that the budget still spends too much. And it’s good to have them warning against repeating the excesses of the Schwarzenegger years, and of the Davis years before that.
But for now, at least, Brown prudently still is keeping spending within the Gann Limit.
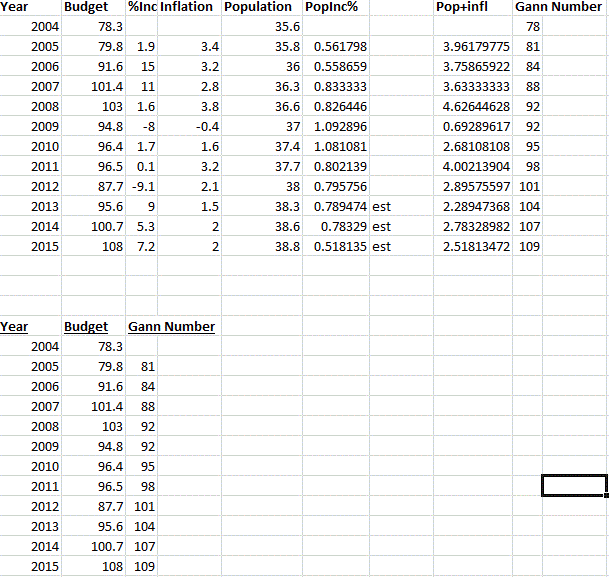
Data
What follows is a snapshot of the spreadsheet I cooked up. The first set of numbers is all the data and calculations. The second set is the numbers broken out that I used to make the chart. I call the budget amount the Gann Limit would have produced the “Gann Number.”
And after that are links to the sources.
Sources
California population:
http://www.infoplease.com/ipa/A0004986.html
https://www.google.com/#q=california+population
Inflation:
Budget:
http://www.ebudget.ca.gov/
Related Articles

Will Spending Cutters Rot in Hell?
MAY 17, 2011 By WAYNE LUSVARDI In my hometown of Pasadena, and I suspect statewide, there is a concerted effort
VIDEO: San Diego mayor discusses whether the Chargers will stay or go
San Diego Mayor Kevin Faulconer describes his plan to keep the San Diego Chargers in San Diego — including the
More Democracy At Election Time
FEB. 2, 2011 by JOHN SEILER “All the ills of democracy can be cured by more democracy,” said Al Smith,
