
Prop. 1 would follow $32 billion past water bonds
 Proposition 1 on today’s ballot marks the first time in 50 years California has proposed building at least two new major dams and reservoirs. If voters concur, by 2023 dams would be built with the $7.5 billion water bond.
An important consideration is how the 21 previous water bonds issued since 1970 have fared. That’s when the State Water Project was completed. Over that 44-year time span, California has spent $32 billion (in 2010 dollars) on water projects funded by water bonds.
What have been the benefits?
The problem is that California does not keep any centralized database of program effectiveness and accountability to determine how much existing water was conserved or recycled, nor how much new water was developed.
The State Department of Finance issues a Bond Accountability Report, but it mainly deals with financial audits and not program effectiveness. According to Jon Coupal of the Howard Jarvis Taxpayers Association, state bonds are mostly slush funds that serve as blank checks with no metrics as to how much water was saved or produced.
21 water bonds
A compilation of the 21 state water bonds issued since 1979, together with a timeline of water improvement projects completed (see table and timeline below), indicates the following:
- The Proposition 13 Water Bond of 2000 reportedly produced 306,727 acre-feet of new groundwater supplies, according to Stanford’s Water in the West program.
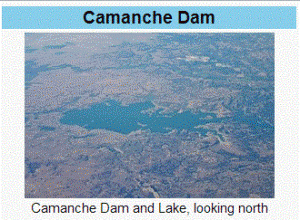
- Five new dams were built since 1970: New Melones Dam, Warm Springs Dam, New Spicers Meadow Dam, Los Vaqueros Dam and Diamond Valley Lake Dam. But all were funded by the federal government or local water agencies without any state bond funding. These five new dams were storage dams, not water-capture dams. So they added no new water to the state water grid that could aid farmers or cities during droughts.
- According to data provided directly to CalWatchdog.com by the California Department of Water Resources, the Proposition 50 Water Bond of 2002 provided matching funding of $11.7 million for $111,837,173 in new Desalination Plants. The plants produce about 45,803 acre-feet of new water per year, at a cost of $2,442 per acre-foot of new water produced.
- Metrics on the amount of water conserved from land and open space purchases, landscaping and forestation and other watershed projects are not produced by state agencies that administer bond funds. Homeowners who cut back water use and install water-efficiency measures on their own do not require water-bond funding; and water conservation data is not available. About 85 percent of the expenditures on water management in California from 1995 to 2010 were by local water agencies, not state or federal water agencies (see California Water Plan, Chapter 7, Finance Planning Framework, Page 7-17).
- One of the largest sources of water added to California’s water system in the past 50 years came from a transfer of 200,000 acre-feet of water per year from the Imperial Irrigation District in Imperial County to the San Diego County Water Authority; and 103,000 acre-feet of conserved water per year to the Metropolitan Water District from concrete lining of irrigation canals at a cost of $258 per acre-foot of water conserved. State water bonds were not used to fund this water transfer.
Summing up
In sum, about 352,530 acre-feet of water since 1970 were added to the state water system funded by state water bonds, most of it invisible groundwater, at a cost of $32 billion.
During that period, California’s population has nearly doubled, from 19.95 million to 38.33 million, for an increase of 18.38 million.
Assuming that an acre-foot of water supports two households per year; and the average California household size is 3 persons. Then California has added about 14.9 gallons of water per day for each additional new person added to the population since 1970.
However, each person generally uses about 149 gallons of water per day.
So California has only produced about 1/10 (14.9 gallons) of the water needed to support its added population since 1970 (149 gal./14.9 gal.).
Yet it still has paid for its 21 water bonds at an unbelievable cost of $9,204 per acre-foot of water ($32,448,000,000/352,520 = $9,204/acre foot installed).
There is an old saying, “You can’t squeeze water from a stone.” Likewise, history indicates California squeezes little measurable water out of so-called state water bonds.
California General Obligation Water Bonds from 1979 to Present
| Year | Title | Base Amount (millions) | In 2010 Dollars (millions) | Timeline Major Events & Projects & Added Water |
| 2008 | Safe Drinking Water, Water Quality and Supply,Flood Control, River and Coastal Protection Bond Act of 2006 (Prop. 84) | $5,388 | $5,777 | 2013-14 Epic Drought |
| 2008 | Disaster Preparedness and Flood Protection Bond Act of 2006 (Prop. 1E) | $4,090 | $4,388 | 2007 State Water Project Shutdown for Fish |
| 2002 | Water Security, Clean Drinking Water, Coastal and Beach Protection Act of 2002 (Prop. 50) | $3,440 | $4,372 | |
| 2002 | California Clean Water, Clean Air, Safe Neighborhood Parks, and Coastal Protection Act of 2002 (Prop. 40) | $2,600 | $3,308 | 2001 Klamath Project Irrigation Crisis |
| 2000 | Safe Neighborhood Parks, Clean Water, Clean Air and Coastal Protection Bond Act of 2000 (Prop. 12) | $2,100 | $2,805 | Prop. 13 306,727 new acre-feet of groundwater developed |
| 2000 | Safe Drinking Water, Clean Water, Watershed Protection and Flood Protection Act (Prop. 13) | $1,970 | $2,632 | 1998 Los Vaqueros Dam; 0 acre-feet |
| 1996 | Safe, Clean, Reliable Water Supply Act (Prop. 204) | $995 | $1,471 | 1995 Diamond Vly. Lake; 0-acre feet |
| 1988 | Clean Water and Water Reclamation Bond Law of 1988 (Prop. 83) | $65 | $120 | 1989 MWD & Imperial Irrigation District agreement |
| 1988 | Water Conservation Bond Law of 1988 (Prop. 82 | $60 | $110 | 1989 New Spicers Dam; O acre-feet |
| 1988 | California Wildlife, Coastal, and Park Land Conservation Act (Prop. 70) | $776 | $1,427 | |
| 1988 | California Safe Drinking Water Bond Law of 1988(Prop. 81) | $75 | $138 | |
| 1986 | California Safe Drinking Water Bond Law of 1986 (Prop. 55) | $100 | $193 | |
| 1986 | Water Conservation and Water Quality Bond Law of 1986 (Prop. 44) | $150 | $290 | |
| 1984 | Fish and Wildlife Habitat Enhancement Act of 1984 (Prop. 19) | $85 | $170 | |
| 1984 | Clean Water Bond Law of 1984 (Prop. 28) | $325 | $651 | |
| 1984 | California Safe Drinking Water Bond Law of 1984 (Prop. 25) | $75 | $150 | 1983 Warm Springs Dam – only serves Sonoma Co.; 0 acre-feet |
| 1982 | Lake Tahoe Acquisitions Bond Act (Prop. 4) | $85 | $185 | 1982 Peripheral Canal Defeated |
| 1978 | Clean Water and Water Conservation Bond Law of 1978 (Prop. 2) | $375 | $1,123 | 1978 New Melones Dam U.S. Govt.; Now green dam; 0 acre-feet |
| 1976 | California Safe Drinking Water Bond Law of 1976 (Prop. 3) | $175 | $606 | 1977-78 Severe Drought;Calif. Ground Water Bulletin 1975 |
| 1974 | Clean Water Bond Law of 1974 (Prop. 2) | $250 | $1,028 | 1973 First Deliveries of State Water Project to So. Calif. |
| 1970 | Clean Water Bond Law of 1970 (Prop. 1) | $250 | $1,504 | |
| Total | $32,448 | |||
| Source: California Water Plan 2014 – Chapter 7 – Financial Planning Framework (go to California Water Plan, Chapter 7 – Financial Planning Framework, Page 7-23, California General Obligation Bonds from 1970 to Present). Table of Contents for California Water Plan is here). | Source: California Water Timeline | |||
Related Articles

California Solar Initiative: overhyped and underperforming
Now that the $2.167 billion California Solar Initiative is winding down, electricity ratepayers might ask: What was it and what
Water Keeps CA's Welfare State Liquid
SEPT. 14, 2010 By WAYNE LUSVARDI Book Review: Running Out of Water: The Looming Crisis and Solutions To Conserve Our
Independence Day from foreign energy?
As today we celebrate America’s independence from Great Britain, it might also be time to celebrate our independence from foreign
